
Figure 6.
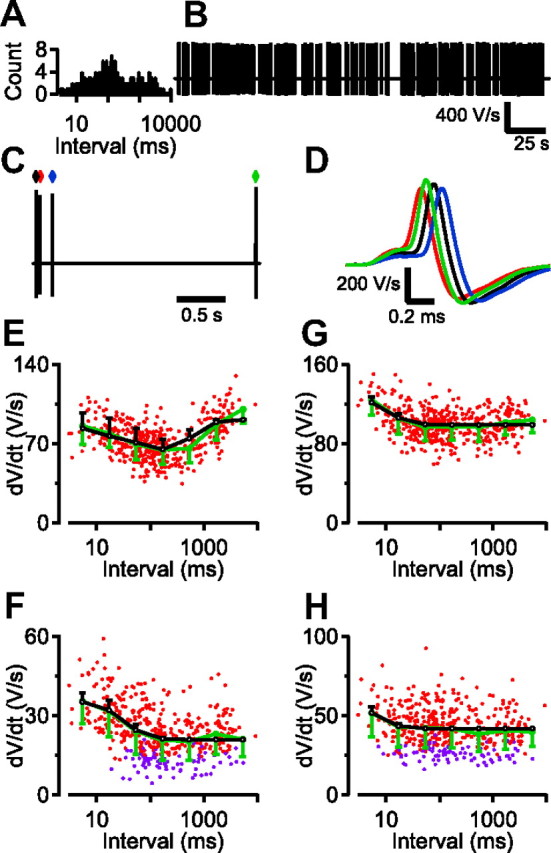
Developmental changes in STP in slices during in vivo-like stimulation. A, Histogram of intervals for stimulus protocol. B, Time derivative of whole-cell current-clamp responses of a P5 cell to in vivo-like stimulus protocol. Note the large range and random character of intervals between stimuli. C, Small segment of the responses shown in B. D, Responses shown in C aligned at the rising phase of the iEPSP. Colors correspond to markers above the trace in C. E, Interval dependence of the iEPSP maximal amplitude in a P5 cell at 1.2 mm calcium. The green curve indicates binned average. Error bars show the SD. The black circles are the result of the fit with an STP model, with amplitude 91.4 V/s; 74% facilitation per AP, decaying with a time constant of 95 ms; and 33% depression per AP, decaying with a time constant of 0.5 s. The fit could account for 50% of the variance in the iEPSP amplitudes. F, As in E, except that the calcium concentration was 0.6 mm. Red circles are suprathreshold EPSPs, blue subthreshold. The fit parameters were as follows: amplitude 21 V/s, 70% facilitation per AP, decaying with a time constant of 35 ms. The fit accounted for 28% of the amplitude variance. G, As in E, except that the recording was from a P15 animal. Fit parameters were as follows: amplitude 103 V/s; 47% facilitation per AP, decaying with a time constant of 10.2 ms; 1% depression per AP, decaying with a time constant of 1.7 s. The fit accounted for 18% of the amplitude variance. H, As in G, except that the calcium concentration was 0.6 mm. Fit parameters were as follows: amplitude 42 V/s, 74% facilitation per AP, decaying with a time constant of 5.4 ms. Fit accounted for 4% of the variance.