
Figure 8.
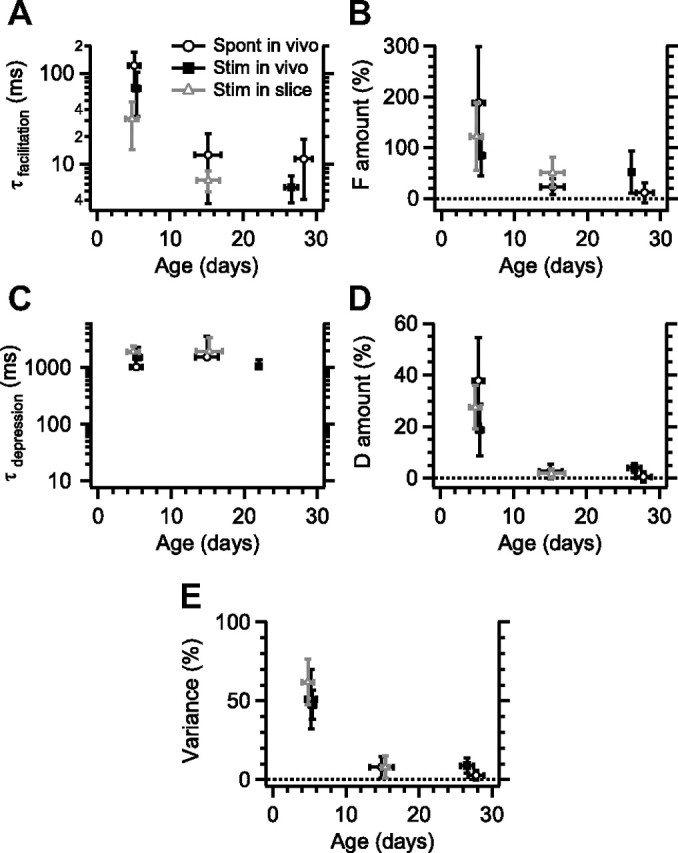
Comparison of developmental changes in STP in vivo and in vitro. The following three types of experiments are included: spontaneous in vivo data (Fig. 4, open circles; same data), slice data (open gray triangle), and electrically evoked in vivo data (closed squares). Symbols show binned averages with SDs. If multiple protocols from the same cell were applicable, the average from the different protocols was used. A, Developmental decrease in time constant of facilitation, as obtained from the fit with an STP model. Only fits that showed significant facilitation are included. B, As in A, showing the developmental changes in the amount of facilitation. Fits showing only depression are not included. C, Age dependence of the time constant for recovery from depression as obtained from the fit in cells with significant depression. Fits for slice experiments performed at 0.6 mm were not included to calculate the amount or time constant of depression. D, Developmental decrease in the amount of depression. Fits without significant depression were included as 0%. E, Developmental decrease in the coefficient of determination, the percentage of variance that can be explained by the model fit. For stimulation experiments, only the in vivo-like protocols were included. Slice experiments performed at 0.6 mm were not included. Fits without both significant facilitation and depression were included as 0%.