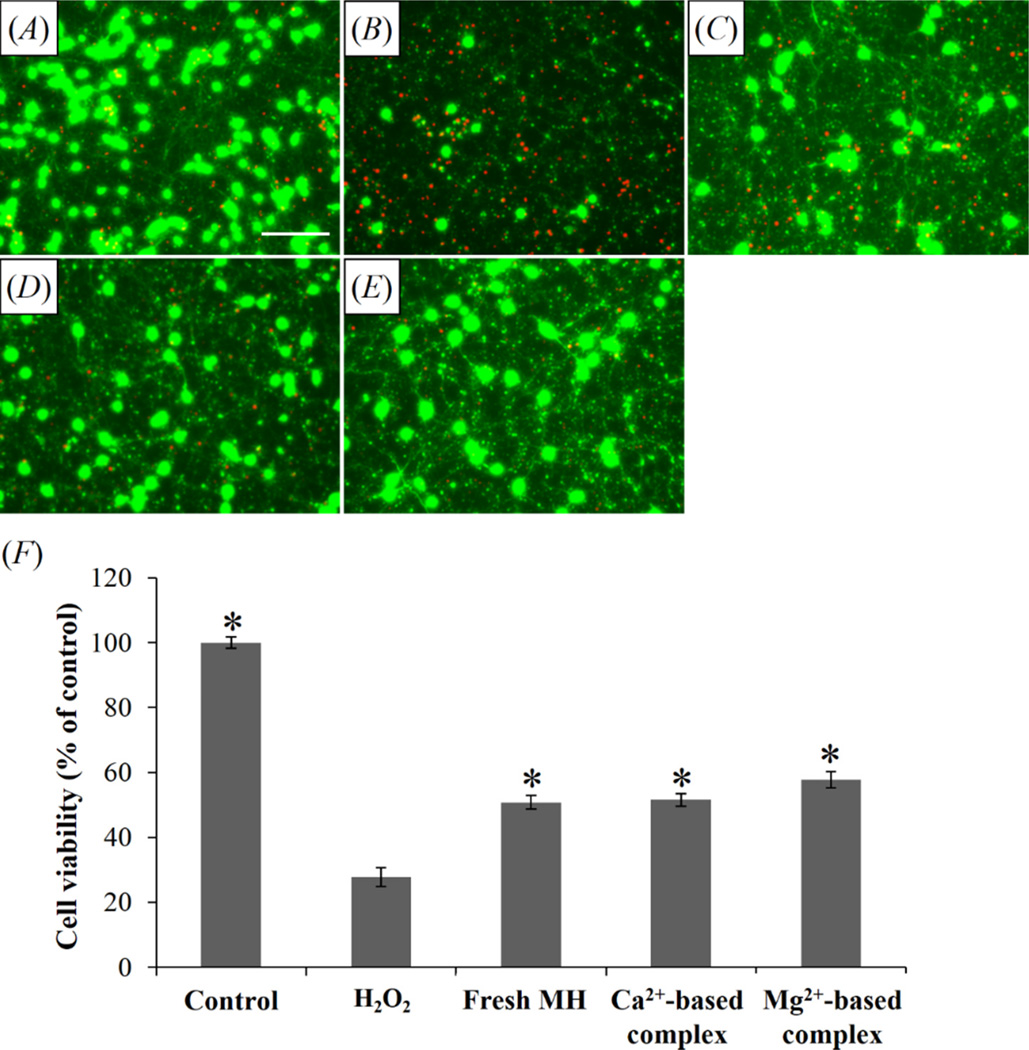
Figure 9.
The neuroprotective activity of released MH. Fluorescent images showing the morphology of cortical neurons (green: “live” cells stained with Calcein AM; red: “dead” cells stained with ethidium homodimer) treated with (A) untreated control, (B) 100 µM H2O2, (C) 100 µM H2O2 and fresh MH, (D) 100 µM H2O2 and MH released from Ca2+-based complex, and (E) 100 µM H2O2 and MH released from Mg2+-based complex. Scale bar = 50 µm. (F) Cell viability with different treatments. *P < 0.05 compared with H2O2-treated group. Data shown are average ± STD (n=3).

