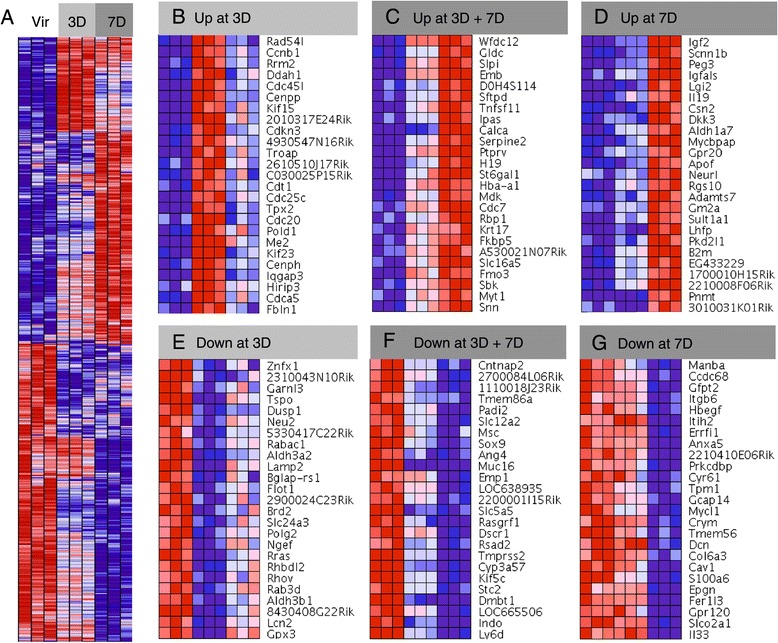
Figure 4.

Heat maps of transcriptional changes in HR+ during early pregnancy. (A) Heat map of Illumina gene probes generated by GenePattern software showing transcriptional changes during early pregnancy. (B-C) Heat maps generated with an input of the 25 most up-regulated and 25 most down-regulated genes in each category based on the values of their Pi scores (see Methods). Twenty-five gene probe sets that are induced (B) and reduced (C) most strongly in HR+ cells specifically at day 3 of pregnancy. (D-E) Gene probe sets that are most strongly induced (D) and reduced (E) in early pregnancy. (F-G) Gene probe sets that are induced (F) and reduced (G) most strongly in HR+ cells specifically at day 7 of pregnancy.
