
Figure 5.
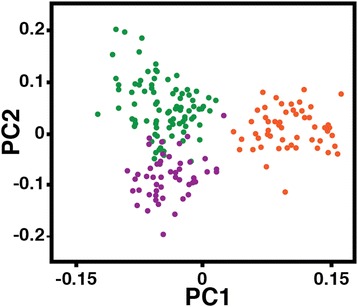
Principal Components Analysis (PCA). PCA generated on the basis of individual genotypes. Individuals are color coded according to geographic origin; (i) purple – western Cameroon and eastern Nigeria, (ii) green – central Cameroon, and (iii) orange – southern Cameroon. PCs 1 and 2 (shown) represent the eigenvectors that accounted for 71 and 21%, respectively, of the total extracted variation.