
Fig. 2.
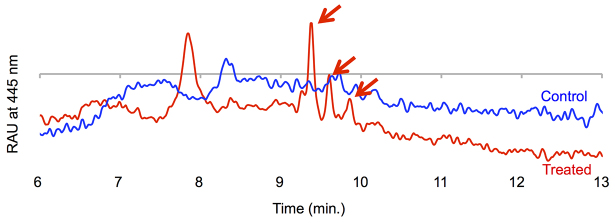
Intravenously injected A2E reaches the RPE layer. Representative HPLC traces of organic extracts from an 11-mm-diameter section of the RPE and choroid, from a 7-week-old New Zealand rabbit administered 10 mg of A2E per kg of body weight intravenously 7 days prior to sacrifice (red curve), and from a non-injected 7-week-old control rabbit (blue curve). A2E is seen as a series of peaks highlighted by the arrows. RAU, relative absorption units. A2E retention times differ compared with Fig. 1 because different HPLC conditions were used (see Materials and Methods).