
Fig. 3.
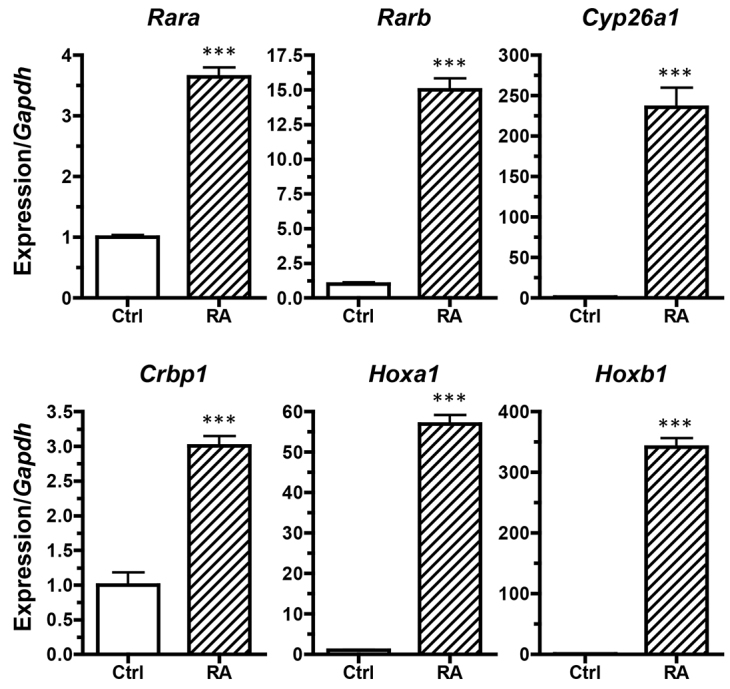
RA target gene expression in response to ATRA treatment in P19 cells as assessed by qPCR. The P19 cell cultures were treated with either DMSO vehicle (Ctrl) or 1 μM ATRA (RA) for 24 hours, with transcript levels quantified by qPCR. Gene expression was normalized to the expression of Gapdh, and is shown relative to the DMSO-vehicle-treated control expression (set at 1). The induction of RA targets in P19 cells indicates the suitability of the P19 cell model for investigating responses to RA signaling. Results are mean±s.e.m. (n=6). ***P<0.001 (Student’s t-test).