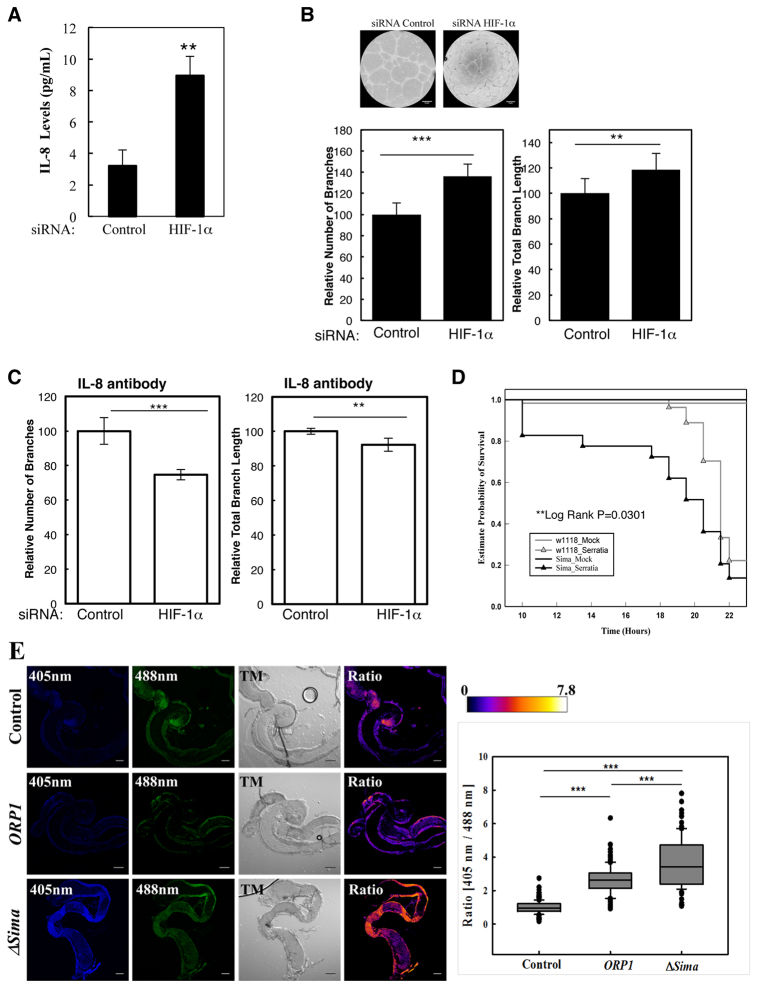
Fig. 7.
HIF-1α depletion results in increased angiogenesis in cancer cells and enhanced mortality following infection in Drosophila. (A) IL-8 protein levels were measured in the medium that had been derived from HeLa cells transfected with control or HIF-1α siRNA oligonucleotides for 48 h. The graph depicts the means and standard error of the mean from three independent experiments. (B) HUVEC cells were used to produce endothelial tubes and then incubated with medium derived from HeLa cells transfected with control or HIF-1α siRNA oligonucleotides for 48 h. Example images are shown and the graphs depict mean+s.d. from three independent experiments, where the number of branches and total branch length were measured. Student’s t-test analysis was performed *P≤0.05, **P≤0.01, ***P≤0.001. (C) HUVECs were treated as described in B, but medium was incubated with an antibody against IL-8 for 2 h before being used. The graphs depict mean+s.d. from three independent experiments, where the number of branches and total branch length were measured. (D) Wild-type adult flies (w1118) and HIF-α loss-of-function flies (sima07607) were pricked using a thin needle dipped in a diluted overnight culture of Serratia marcescens Db10 (OD600=0.2) or in a saline solution (Mock). Groups of 60 to 80 flies were used and kept at room temperature. Survival was monitored and expressed as the ‘estimated probability of survival’. The P-value was obtained from log-rank statistical analysis. (E) H2O2 sensing by ICMT flies (Control), roGFP2-ORP1 (ORP1) and Sima loss-of-function roGFP2-ORP1 (ΔSima) transgenic flies was analysed 6 h following infection with Serratia marcescens. TM, transillumination or bright field. Images were acquired using a Zeiss confocal microscope and analysed using ImageJ. The ratio image was obtained by dividing the 405-nm image by the 488-nm image pixel by pixel and displayed in false colours using the lookup table Fire (arbitrary units). The values obtained were imported into Sigma-Plot software, which was used to generate box and whisker plots. In the plot, the middle line shows the median value, the bottom and top lines represent the lower and upper quartiles. Whiskers extend to 10th and 90th percentiles and all the outliers are shown. Quantification was performed using ten adult flies in two independent experiments, +s.d. Scale bars: 100 μm. Student’s t-test analysis was performed *P≤0.05, **P≤0.01, ***P≤0.001. See also supplementary material Fig. S6.

