
Figure 5.
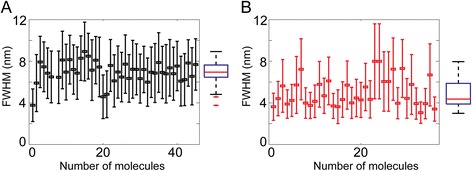
Example of semi-automated analysis of biomolecules, effect of SFM-probe end radius of curvature on DNA width. A) Measurements done with AppNano ACT-W probe (nominal radius of curvature 5 nm). Average FWHM from at least 200 cross-sections and STD (error bars) is plotted for each of the 45 DNA molecules (pUC19) analysed. Boxplot summarizing the data is depicted to the right side of the graph. Red line, median (6.9 nm); the edges of the blue box are the 25th (6.4 nm) and 75th (7.6 nm) percentiles, the whiskers extend to the most extreme data points not considered outliers (red crosses). B) Measurements done with Nanosensors SSS-NCH probe (nominal radius of curvature 2 nm) as in A from 36 DNA molecules (pUC19) analysed. Boxplot data: median = 4.4 nm; 25th percentile = 3.9 nm; 75th percentile = 5.9 nm.