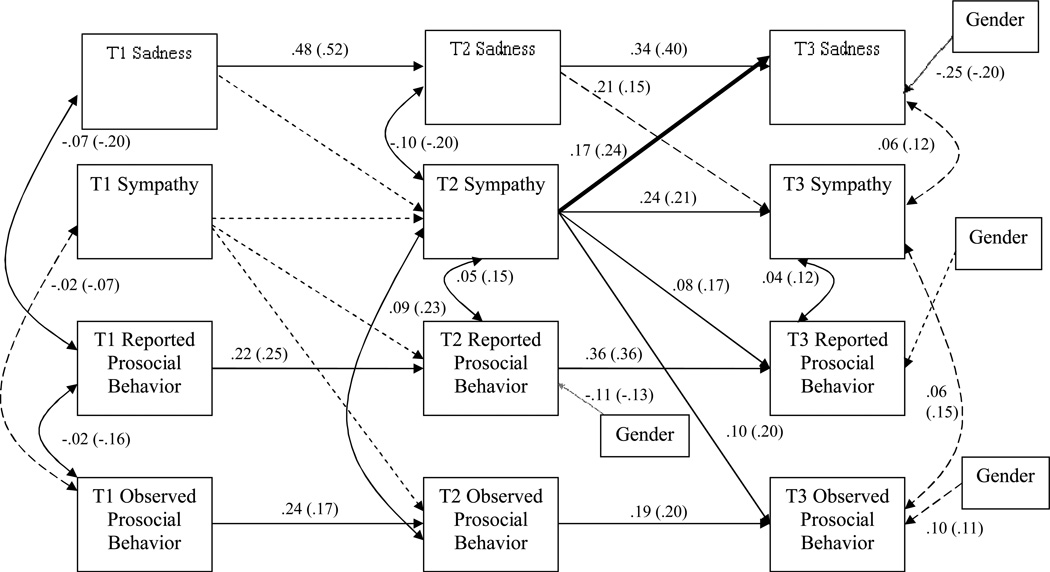
Figure 1.
Final path model. Solid lines represent significant regression paths; long dashed lines represent marginal regression paths; short dashed lines represent non-significant regression paths; solid curved lines represent significant correlations among constructs within time; long dashed curved lines represent marginal correlations among constructs within time. Unstandardized estimates are presented first; fully standardized estimates are presented in parentheses.

