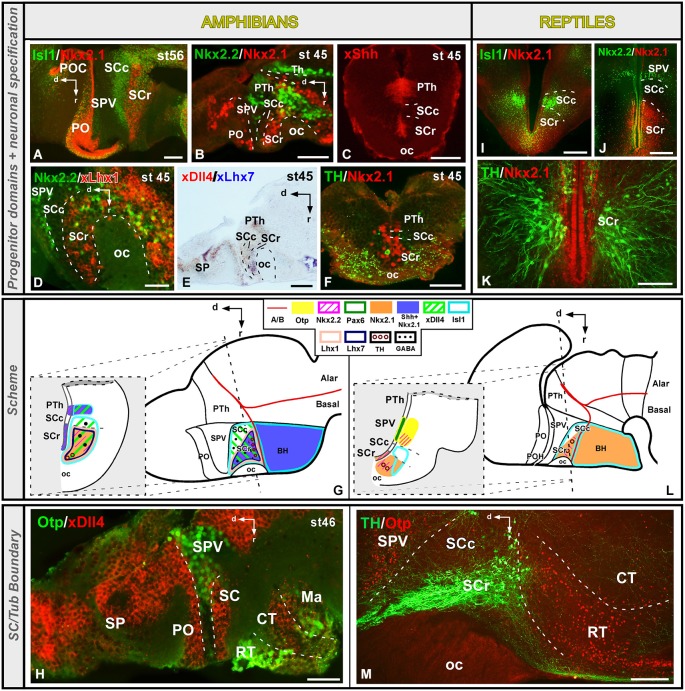
Figure 4.
Comparative aspects of the suprachiasmatic (SC) territory between amphibians and reptiles. Photomicrographs of transverse (C,F,I–K) and sagittal (A,B,D,E,H,M) sections through the developing SC territory of Xenopus (A–H) and Pseudemys (I–M) illustrating its molecular profile based on the combinatorial expression of different transcription factors and neuropeptides indicated in each figure. The developmental stage in the cases of Xenopus is also marked. (G) and (L) are summarizing schemes of lateral views of the brains in which the main molecular features of the SC region are illustrated according to the color code indicated. In both schemes, a transverse section through the level indicated on the lateral view of the brain is illustrated. Scale bars = 25 μm (D,H), 50 μm (B,C,E,F), 100 μm (A,K), 200 μm (I,J,M).

