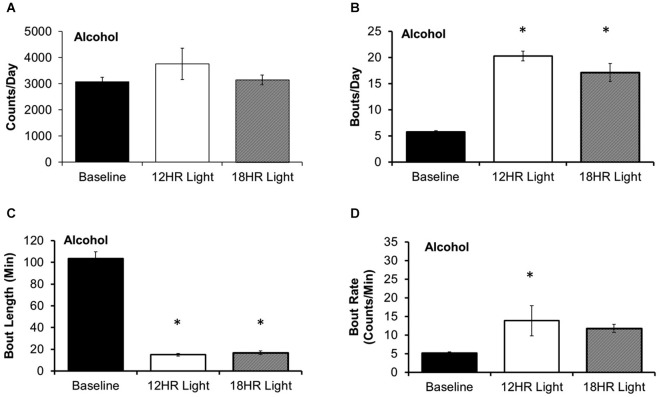
Figure 3.
Bout analysis of alcohol drinking by photoperiod. (A) There were no differences in the total counts on the alcohol lickometer between photoperiods. (B) Mice increased the number of bouts per day during both CD photoperiods. (C) Balancing the increased number of bouts, mice drank alcohol in shorter bouts in the CD photoperiods. (D) The rate of licks in each bout only increased in the 12HR photoperiod (data indicate the mean ± SEM for n = 8; asterisks indicate significant differences from baseline at p = 0.05).

