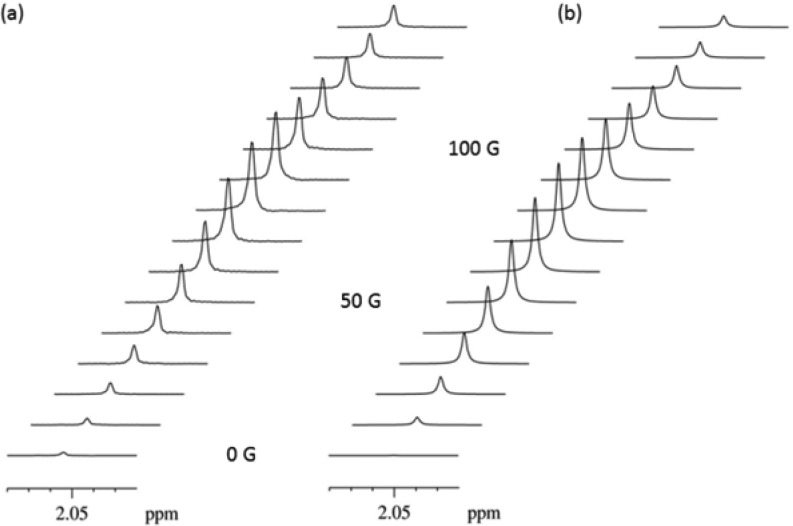
Figure 1.
(a) Plot of the 1H NMR signal intensity seen for free CH3CN as a function of the PTF (indicated); data produced by a CD3OD solution containing 1 (10 mg), CH3CN (0.1 M) and pyridine (0.02 M). (b) Matching theoretical plot of the predicted 1H NMR signals. The phase of the detected signals has been inverted for ease of viewing.

