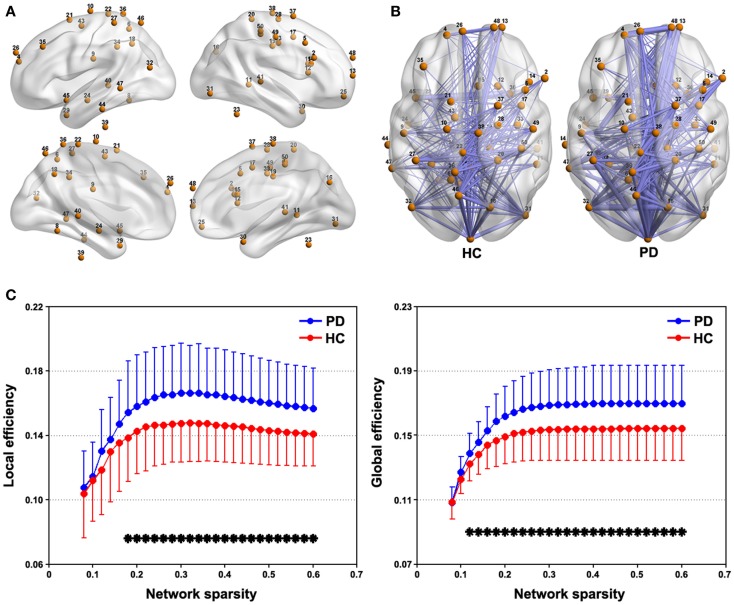
Figure 3.
Between-group differences in network efficiency. (A) Brain surface representation of the 50 ROIs showing abnormal connectivity in PD. (B) mean connectivity patterns among the 50 ROIs for the PD and NC groups that were thresholded at a sparsity = 0.3. (C) Local and global efficiency the 50-ROI network in the PD and HC groups as a function of sparsity. *P < 0.05, FDR corrected.

