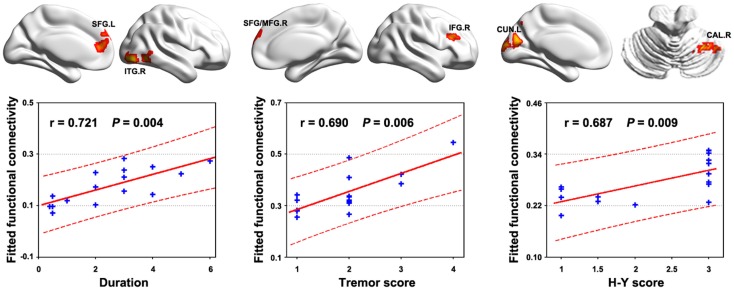
Figure 4.
Relationship between functional connectivity and clinical variables in PD patients. Significant correlations (P < 0.05, FDR corrected) of multiple functional connectivities were observed with the behavior performance of the patients. The figure shows the most significant correlations for the duration, tremor, and H–Y score. All the detected correlations are listed in Table S1 in Supplementary Material.

