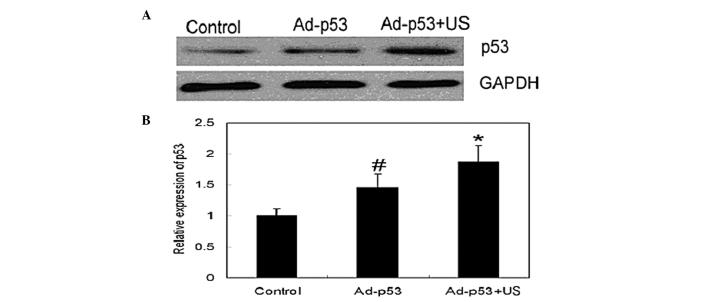
Figure 1.
Effect of different administration methods on the protein expression levels of p53 in tumor tissues. (A) Representative western blot image; and (B) statistical results of the relative protein expression levels of p53. n=5; #P<0.05, vs. the control group; *P<0.05, vs. the Ad-p53 group. Ad-p53, adenovirus-p53; US, ultrasonic irradiation.

