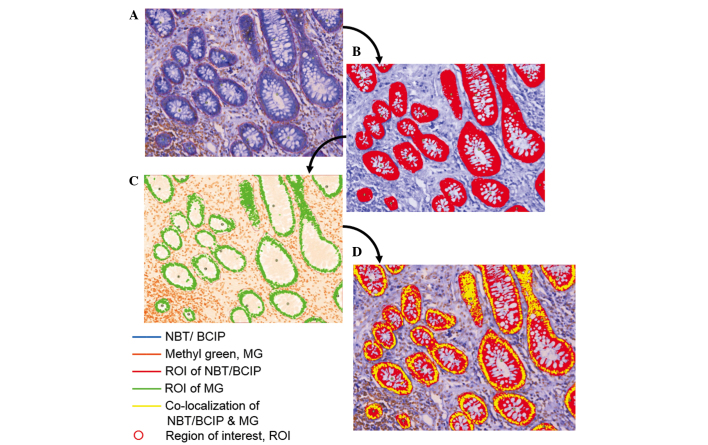
Figure 2.
CRi-Nuance™ Multispectral Imaging System was applied to analyze the expression level of miR-92a in colorectal adenocarcinoma and its precancerous lesions. Applying the function of co-localization of Nuance to analyze the expression level of miR-92a in colorectal tissue, the expression pattern and intensity were then generated as raw data for further statistical assay. (A) A different color was appointed to represent NBT/BCIP and MG, and the region of interest was circled. In the image, blue represents NBT/ BCIP, orange represents MG and red circles represent the region of interest. (B) The threshold of ROI was adjusted and the orange color represents the area where miR-92a is expressed. (C) The threshold of MG was adjusted and the green color represents the area stained with the dye. (D) The threshold of the channel was adjusted, indicating co-localization of NBT/BCIP and MG. The yellow color represents data generated based on the pixel area, followed by calculation of the concentration of NBT/BCIP in the cytoplasm with the formula as provided, which represented the expression of miR-92a. NBT/BCIP, nitro blue tetrazolium/5-bromo-4-chloro-3-indolyl phosphate; ROI, region of interest; MG, methyl green.

