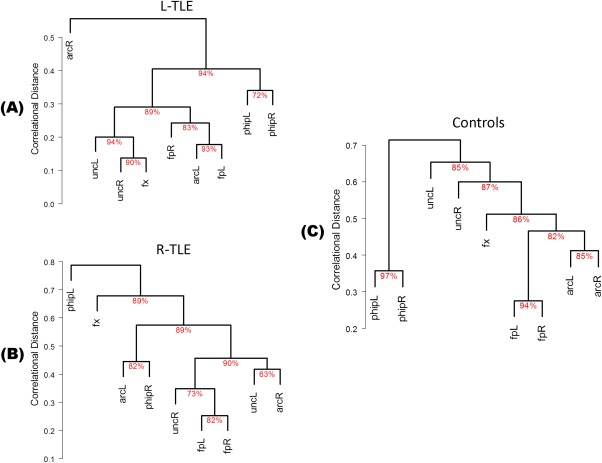
Figure 4.

Dendrograms of bootstrapped hierarchical cluster analysis in LTLE (A), RTLE (B), and Controls (C). The y‐axis indicates the average linkage distance at which tracts merge into clusters. The approximately unbiased (AU) probability of the cluster formation is shown under each connection. [Color figure can be viewed in the online issue, which is available at http://wileyonlinelibrary.com.]
