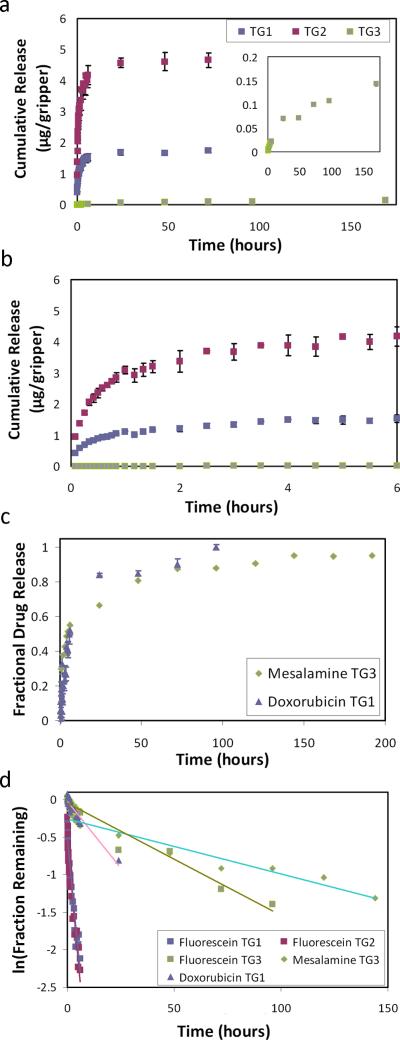
Figure 2.
Quantified release profiles and kinetic analysis. (a) Graph of the cumulative fluorescein release profiles from the theragrippers. Zoomed inset details the slower TG3 release. (b) Zoomed in graph over a shorter time showing the cumulative release over the first 6 hours. (c) Graph of the fractional release of mesalamine and doxorubicin from the theragrippers. (d) First order kinetic model applied to each release profile.

