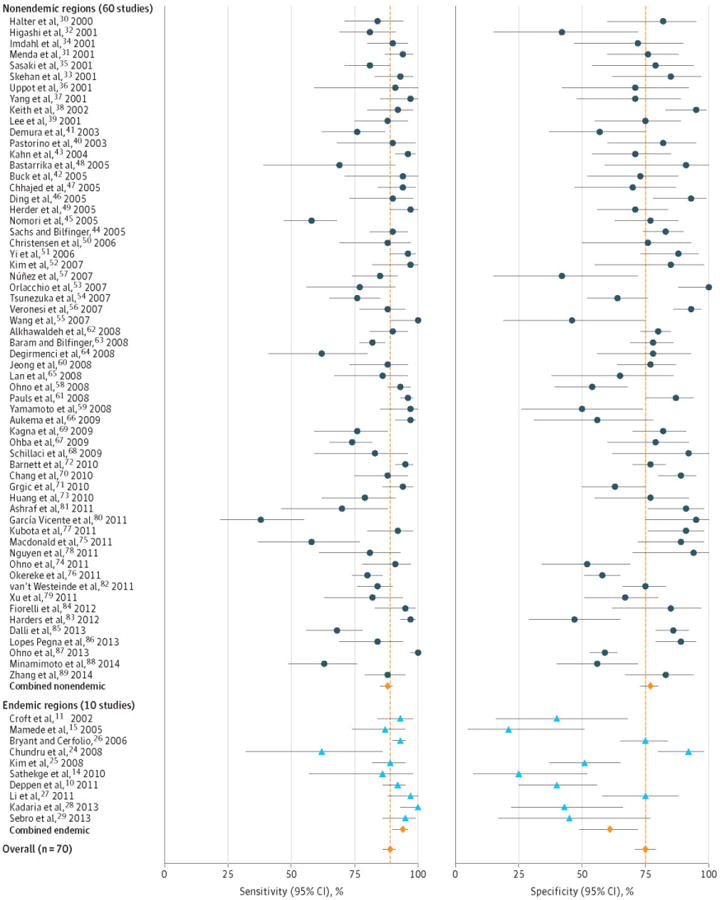
Figure 2. Individual study estimates of sensitivity and specificity with average adjusted results.

Forest plot reporting individual study sensitivity and specificity. Endemic infectious lung disease with are in blue and nonendemic studies are in black. Average adjusted results for endemic studies (n=10), non-endemic studies (n=60) and all studies combined (n=70) sensitivity and specificity are in red. Error bars are 95% confidence intervals for each study's corresponding test characteristic.
