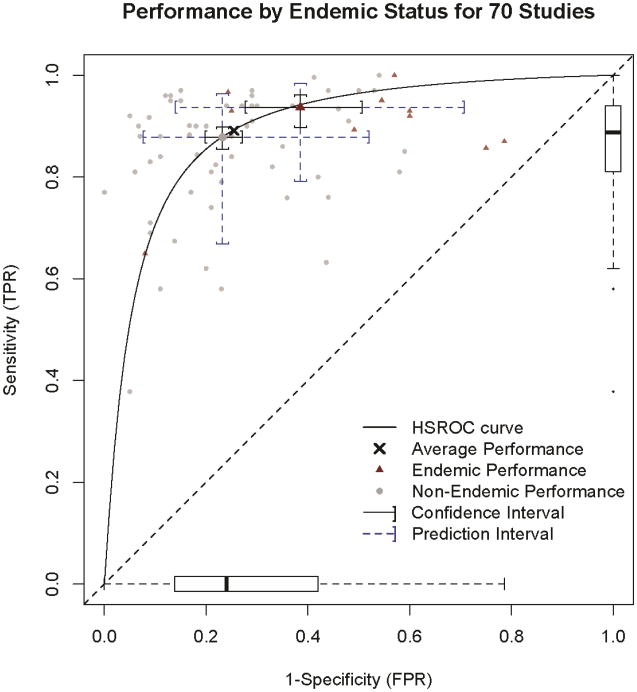
Figure 3. Performance by endemic status for 70 studies.
Hierarchical Summary Receiver Operator (HSROC) Curve with operating points for endemic and nonendemic infectious lung disease studies and 95% Confidence and Prediction Intervals for those operating points. The horizontal box and whiskers plot represents the distribution of study specificity, and the vertical box and whiskers plot represents the distribution of study sensitivity. The box limits are the closest data point to the interquartile range of 25 and 75% with the bar being the median (50%). Error bar whiskers represent the data point closest to 1.5 times the interquartile range and the dots outside the whiskers represent outlier study values.

