
Figure 2.
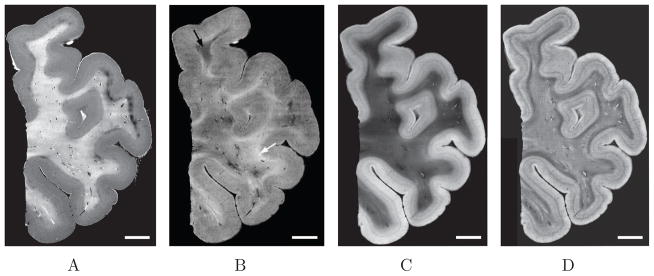
Four panels illustrate the same isocortical sample yet imaged with different contrasts. A: attenuation coefficient image, B: reflectivity image (the arrows showing different fiber orientations, white for parallel to the surface and black for more oblique fibers), C and D represent AIP images but different protocols were performed. C: the tiles are first stitched together, then the whole image is improved (filtering and intensity adjustment). Each tile is first improved to emphasize on the laminar structure of the cortex, then they are stitched together to reconstruct the whole volume. Note the improvement for the white matter in C and the cortical ribbon in D. Scale bar: 5mm