
Figure 5.
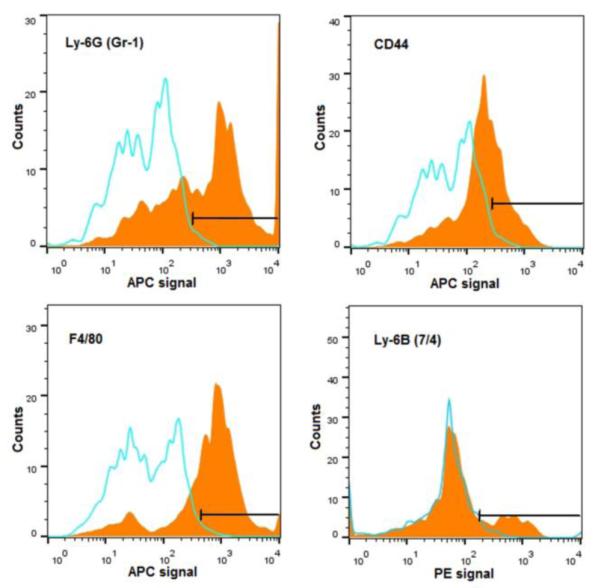
Representative data from Fluorescence Activated Cell Sorting (FACS) analysis of cells isolated from the fracture callus 24 h after systemic administration of Alexa Fluor® 488 labeled SIM/SIM-mPEG micelles. The histogram plots show the intensity of staining with the specific antibodies designated on the x-axis (orange fills) with isotype control antibodies (blue lines) on the same plots. The percentages represent the respective antibody positive cells among Alexa Fluor® 488 labeled SIM/SIM-mPEG micelles: 36.8 % were Ly-6G positive, 30.8 % were F4/80 positive, 15.2 % were Ly-6B positive and 14.2 % were CD44 positive. All data presented were isotype-control corrected.