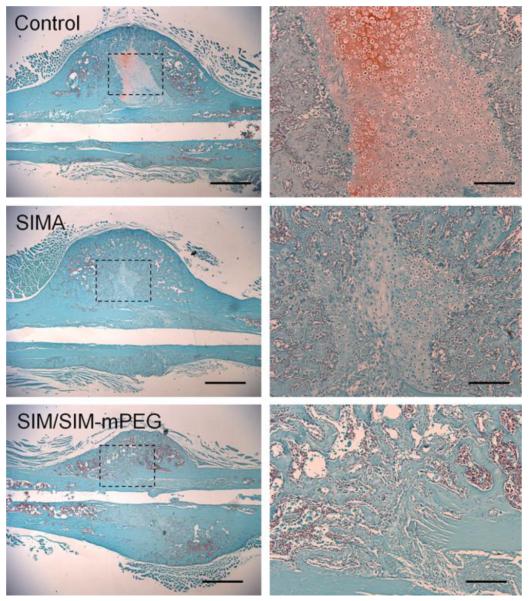
Figure 8.
Representative images of Safranin O stained histological sections of callus from different treatment groups. The three panels on the right are an enlarged presentation (× 10) of the outlined region in the left panels (× 2). The callus sections of the SIM/SIM-mPEG group were devoid of chondrocytes and cartilage matrix, indicating advanced ossification. Bar = 1 mm (left panels) or 0.2 mm (right panels).

