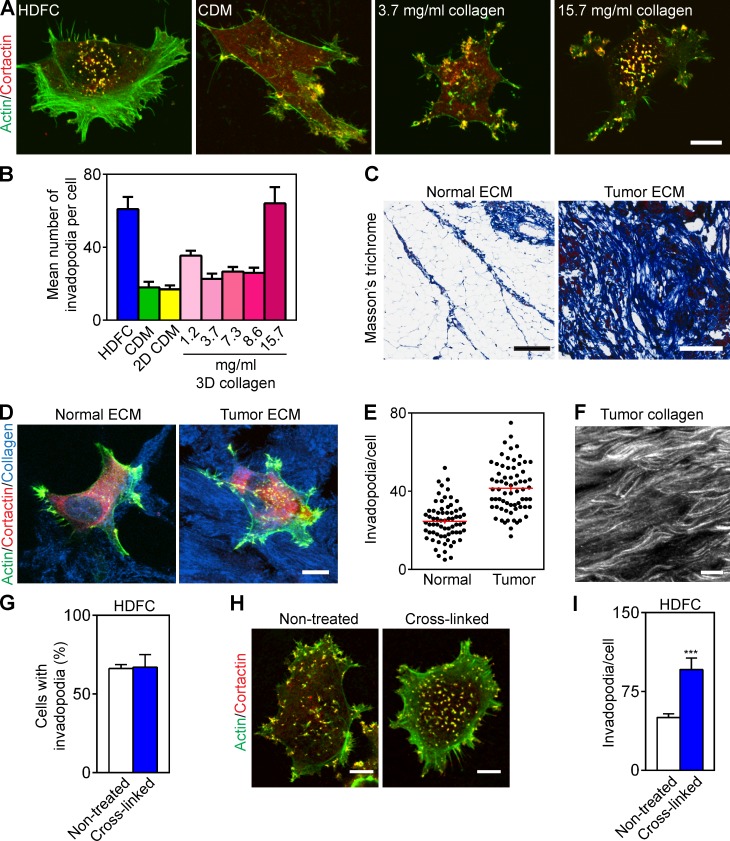
Figure 2.
HDFC mimics tumor desmoplastic collagen. (A) Maximum-intensity projections of immunofluorescence confocal images of MDA-MB-231 cells invading HDFC, cell-derived fibrillar fibronectin matrix (CDM), or thin 3D layers of fibrillar collagen type I polymerized at low versus high concentrations. Invadopodia are yellow dots of overlaid cortactin and actin staining. (B) Quantification of results from A showing invadopodia per MDA-MB-231 cell invading HDFC, CDM, flattened 2D CDM, or thin 3D fibrillar collagen matrices at the specified concentrations. Means ± SEM of each of 10–30 cells/condition from three independent experiments. (C) Masson’s trichrome staining of acellular ECM from normal and tumor breast sections visualizing collagen in blue. (D) Immunostaining of MDA-MB-231 cells invading acellular normal and tumor breast ECM immunolabeled for collagen type I. Invadopodia are yellow dots with colocalized actin and cortactin. (E) Invadopodial response of MDA-MB-231 cells plated on acellular normal or malignant breast ECM. The values (red bars) are mean ± SEM of total invadopodia in each of 68 cells from three independent repeat experiments for each condition. (F) Topography of desmoplastic collagen immunostained for collagen type I. (G) Quantification of invadopodia in cells invading nontreated or chemically cross-linked (4% paraformaldehyde) HDFC matrix. Mean ± SEM of each of 100–111 cells/condition from three independent experiments. (H) Immunostaining of invadopodia in MDA-MB-231 cells invading nontreated or cross-linked HDFC. Invadopodia are yellow dots of colocalized invadopodial markers, actin, and cortactin. (I) Quantification of invadopodia in MDA-MB-231 cells invading nontreated and cross-linked HDFC as in H. Means ± SEM of 19–20 cells/condition. ***, P < 0.0001. Bars: (A, D, F, and H) 10 µm; (C) 300 µm.

