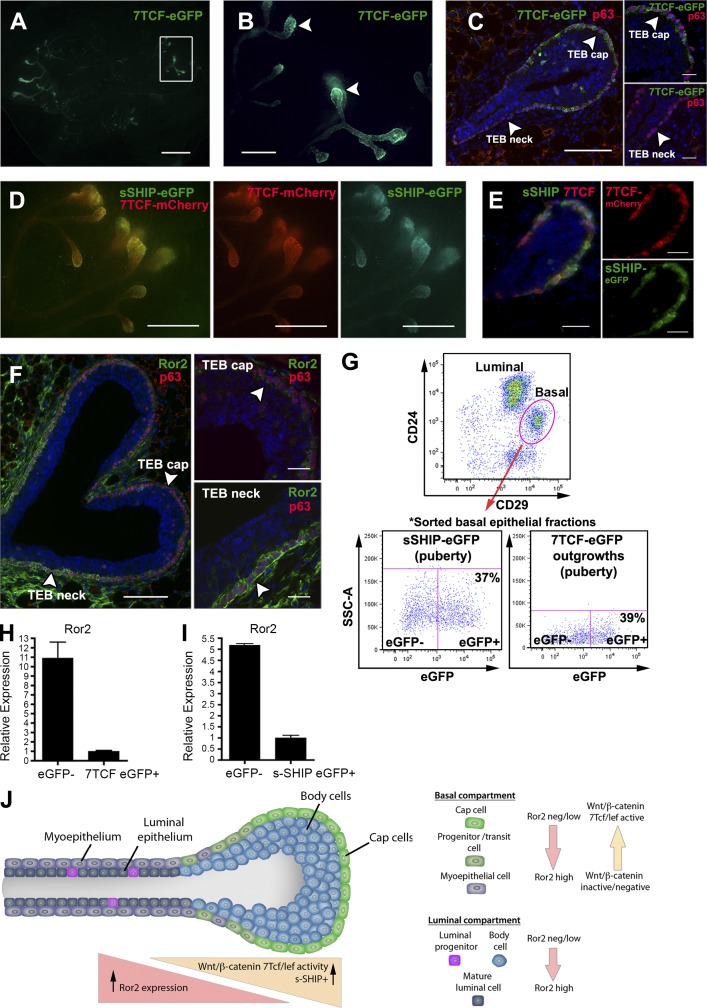
Figure 2.
Wnt/β-catenin signaling activity and Ror2 expression are inversely correlated in the mammary gland. (A) Fluorescent whole mount of a 4-wk mammary outgrowth harboring a lentiviral 7TCF-eGFP reporter to survey Wnt activity in vivo. Wnt/β-catenin activity (eGFP) is enriched in the TEBs of the outgrowth (box). (B) Magnification of the boxed region in A of eGFP Wnt/β-catenin TCF activity in the TEBs (arrowheads). (C) IF for eGFP within a cross-section of the TEB depicting Wnt/β-catenin activity within the p63+ (red) cap cell layer and minimal in the TEB neck (arrowheads). (D) Fluorescent whole mount of s-SHIP mammary outgrowths transduced with a 7TCF-mCherry reporter depicting overlap within the TEBs (yellow), along with individual channels. (E) IF of sSHIP/7TCF-mCherry TEB section showing overlap of sSHIP-eGFP+ and 7TCF-mCherry+ populations within the cap cells (yellow), along with separate channels. (F) IF for Ror2, demonstrating the increase in Ror2 expression along the neck of the TEB (arrowheads, right) and the limited/absent expression within the cap cell layer (arrowheads, right). (G) Representative FACS plots of the sorting schemes for eGFP+ and eGFP− cells from the basal fractions derived from the s-SHIP model and 7TCF-eGFP outgrowths (n = 9 total glands from s-SHIP model and n = 9 total outgrowths from 7TCF-eGFP transplants, with pools of three glands or outgrowths for each replicate). (H) qRT-PCR demonstrating a 10.9-fold increase in Ror2 expression in the eGFP− basal/myoepithelial fraction relative to 7TCF-eGFP+ cap/stem cells (n = 3 replicates). (I) qRT-PCR demonstrating a fivefold increase in Ror2 expression within the eGFP− basal fraction relative to s-SHIP eGFP+ cap cells (n = 3 replicates). Plotted values represent means ± SD (error bars). (J) Model depicting the inverse association of 7TCF/Lef activity and Ror2 expression within the TEB and epithelial subpopulations. Bars: (A) 2 mm; (B) 500 µm; (C, left) 100 µm; (C, right) 20 µm; (D) 1 mm; (E) 50 µm; (F, left) 100 µm; (F, right) 20 µm.

