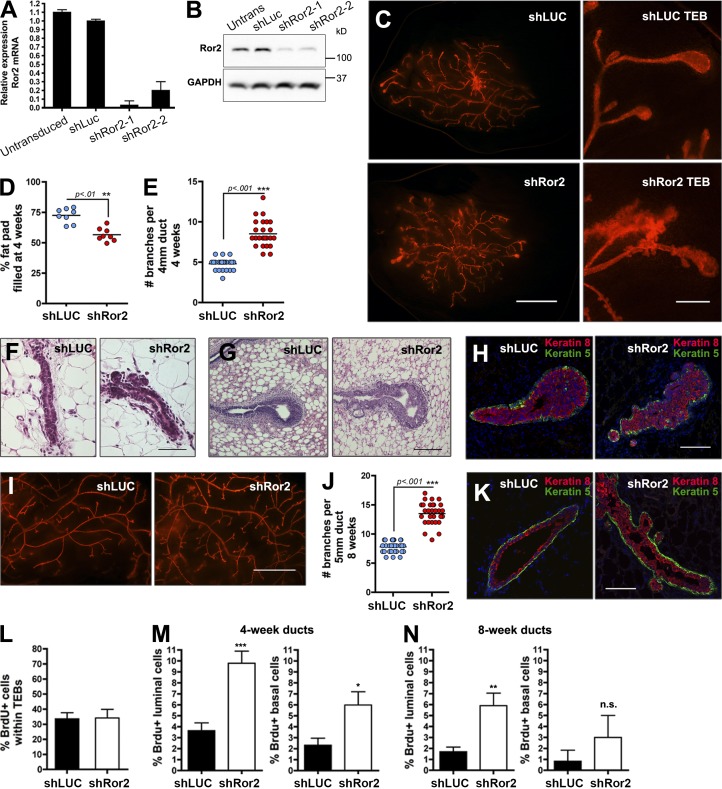
Figure 4.
Ror2 depletion in vivo enhances mammary branching morphogenesis. (A) qRT-PCR of Ror2 expression in untransduced, shLUC, and shRor2-transduced primary MECs. Ror2 mRNA knockdown reached ∼90% using two independent hairpins. (B) Western blot confirming depletion of Ror2 protein levels in primary MECs. (C) Fluorescent whole mounts of 4-wk shLUC and shRor2 outgrowths after transplantation of lentivirus-infected MECs into contralateral cleared #4 mammary fat pads. Panels on the right depict higher magnification of the TEB structures. (D) shRor2 4-wk outgrowths exhibit a lower percentage of fat-pad-filled relative to shLUC controls (n = 8 contralateral glands). (E) Quantification of the increase in branching morphogenesis in shRor2 outgrowths after 4 wk of development relative to shLUC controls (n = 6 contralateral glands). (F and G) H&E staining of ducts (F) and TEBs (G) from shLUC and shRor2 outgrowths representing the enhanced branching and altered TEB morphology after Ror2 depletion. (H) K8/K5 IF within the TEBs at 4 wk depicting proper luminal (red) and basal (green) epithelial cell compartmentalization in shRor2 outgrowths. (I) Fluorescent whole mounts of 8-wk shLUC and shRor2 outgrowths depicting the increase in branching. (J) Quantitation of the increase in branching morphogenesis in shRor2 outgrowths after 8 wk of development relative to shLUC controls (n = 6 contralateral glands). (K) K8/K5 IF depicting proper luminal (red) and basal (green) epithelial cell compartmentalization in 8-wk outgrowths. (L) Quantification of TEB proliferation, assessed by the percentage of BrdU+ cells. (M) Quantification of ductal BrdU+ cells is shown within 4-wk outgrowths. BrdU+ cells were scored by costaining with the luminal K8 and basal K5 markers (n = 5 contralateral glands). (N) Quantification of ductal BrdU+ cells within 8-wk outgrowths (n = 5 contralateral glands; **, P < 0.01). Bars: (C) 2 mm; (F–H) 50 µm; (I) 2 mm; (K) 50 µm. Plotted values represent means ± SD (error bars). *, P < 0.05; **, P < 0.01; ***, P < 0.001.

