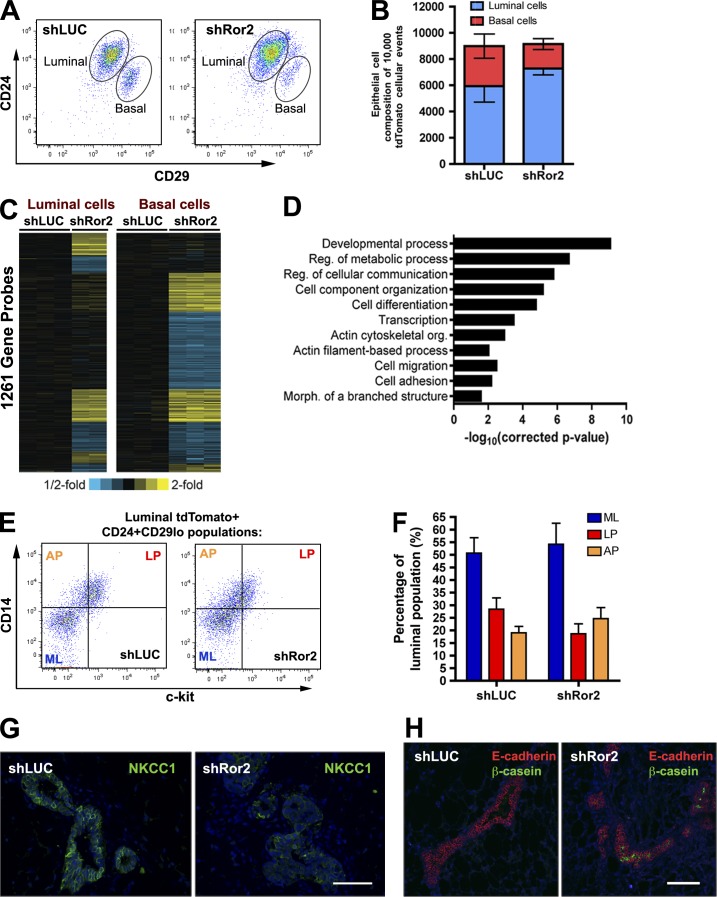
Figure 5.
Depletion of Ror2 elicits compartment-specific changes in luminal and basal epithelial cell layers accompanied by alterations in the differentiation capacity of the mammary epithelium. (A) CD24/CD29 FACs analysis of tdTomato+ transduced mammary epithelium from shLUC and shRor2 outgrowths at 8 wk depicting luminal and basal epithelial compartments (representative plot of n = 4 contralateral shLUC and shRor2 groups). (B) Quantification of the absolute number of luminal and basal epithelial cells from shLUC and shRor2 out of 10,000 tdTomato+ events analyzed (n = 4 contralateral groups; shLUC, 5,933 ± 1,219 luminal cells and 3,053 ± 927 basal cells vs. shRor2, 7,278 ± 482 luminal cells and 1,863 ± 1,863 basal cells). (C) Heat map depicting the specific patterns of gene transcript alterations exhibited in luminal and basal epithelial compartments when Ror2 signaling is impaired (P < 0.01 and expression changes >1.2 fold). (D) Graphical representation of the gene ontology terms significantly enriched in the shRor2 luminal and basal groups. (E) Representative FACS plots of CD14 and c-kit within the luminal fractions of shLUC and shRor2 groups, depicting ML, AP, and LP fractions (representative plot of n = 3 contralateral shLUC and shRor2 groups, each composed of three pooled contralateral pairs from nine mice). (F) Quantitation of ML, AP, and LP fractions within the luminal compartment, showing an increase in AP relative to LP (LP, 18.6 ± 3.9%; AP, 24.7 ± 4.4%) in the shRor2 outgrowths compared with controls (LP, 28.4 ± 4.5%; AP, 19.1 ± 2.5%; n = 3, pooled contralateral pairs from nine mice). Plotted values represent means ± SD (error bars). (G) IF for NKCC1, demonstrating loss of NKCC1 staining in shRor2 epithelium compared with the presence of NKCC1 within ducts of shLUC outgrowths. (H) IF for β-casein (green) in shRor2 outgrowths compared with an absence in shLUC controls. E-cadherin staining (red) defines the ducts. Bars, 100 µm.

