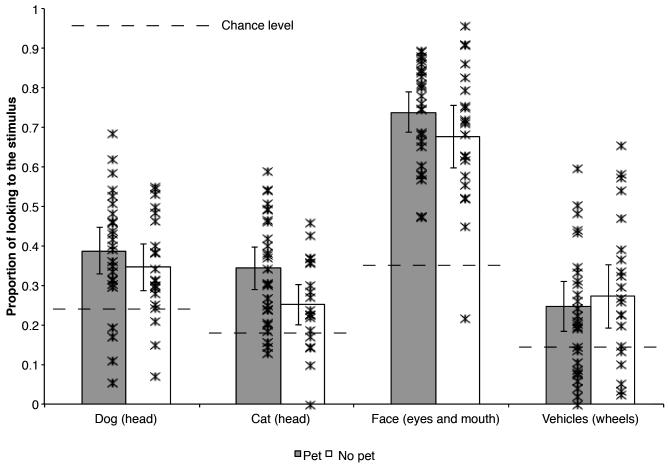
Figure 4.
The mean proportion of infants’ looking devoted to the most informationally rich regions of each stimulus type by pet group (error bars represent 95% confidence intervals; individual infants are represented by with individual asterisks). The lines bisecting the bars represents chance levels (i.e., the area each of the areas of interest comprise in the actual image) for each stimulus type (23% for dog heads, 19% for cat heads, 35% for the eyes and mouths (combined) of human faces, and 16% for the wheels of vehicles); all means were significantly greater than chance, ps? .02.

