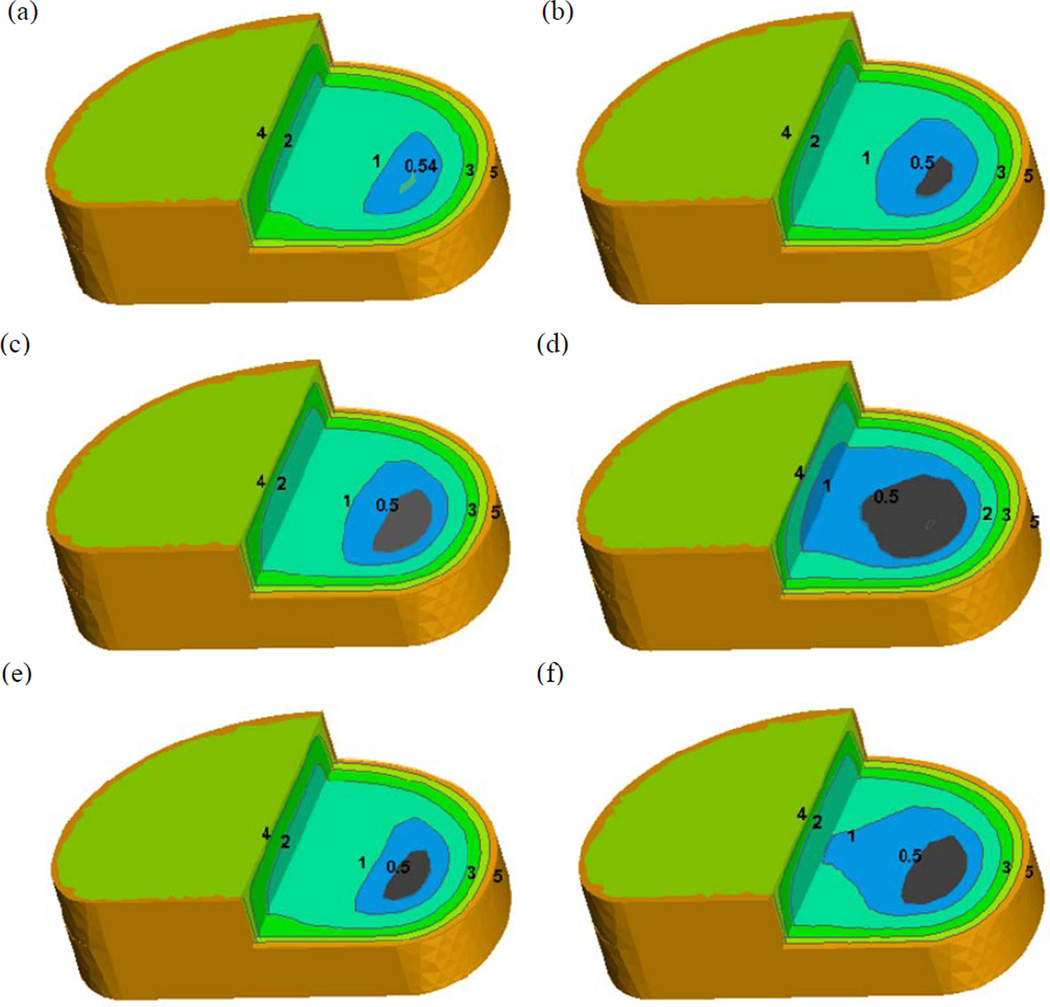
Figure 6.
Effect of increase in cell density on 3D glucose concentration distribution in the disc with a normal CEP (a) (b), calcified CEP (c) (d), and thin calcified CEP (e) (f). The grey color regions indicate the Critical Zones in which the glucose concentration is lower than 0.5 mM [10].

