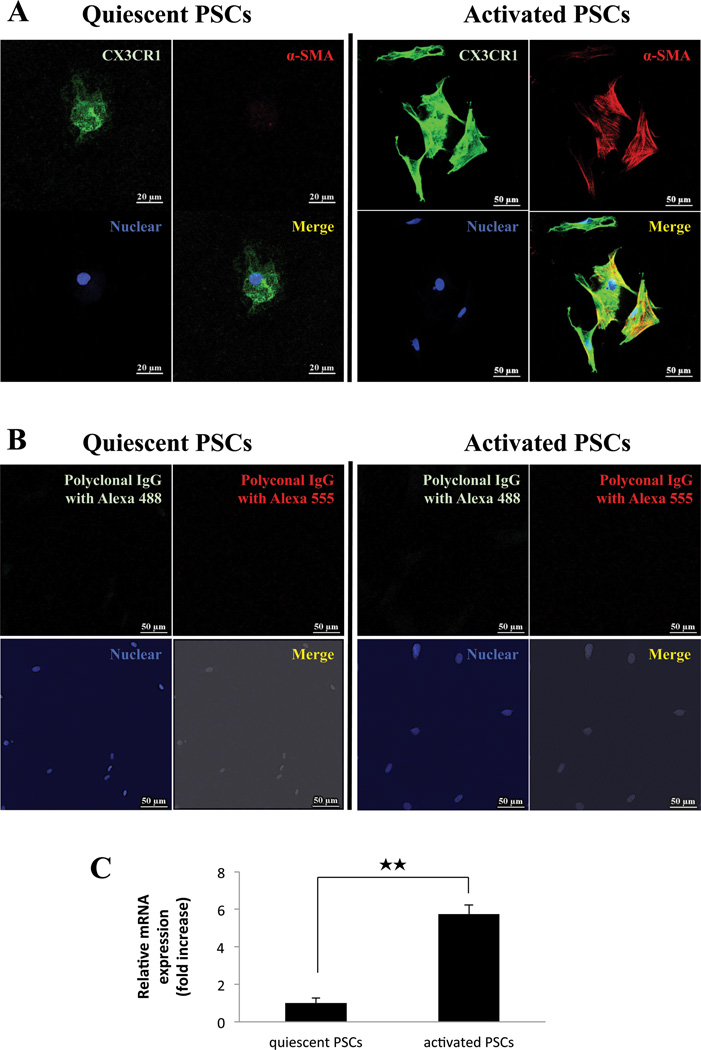
Figure 3. Both quiescent and activated normal pancreatic stellate cells (PSCs) express CX3CR1 in vitro and the expression increases with activation.
Panel A show the expression of CX3CR1 protein in quiescent (2 days after isolation; Magnification is x1000; left panels) and culture-activated PSCs (3rd passage. Magnification is x400; right panels). In Panel A, CX3CR1 is stained in green, α-SMA (activated PSCs) in red, nuclei in blue and co-localization of α-SMA and CX3CR1 in yellow. Panel B is the negative control for Panel A (incubated with Polyclonal IgG antibody and stained with Alexa 488green, IgG with Alexa 555 in red and nuclei in blue). Panel C shows the quantitation of CX3CR1 expression by RT-PCR in quiescent and activated normal PSCs. The result is from 4 experiments for passages 1 and 3. ★★=P<0.01, comparing passage 1 and 3. These results were representative of four experiments.

