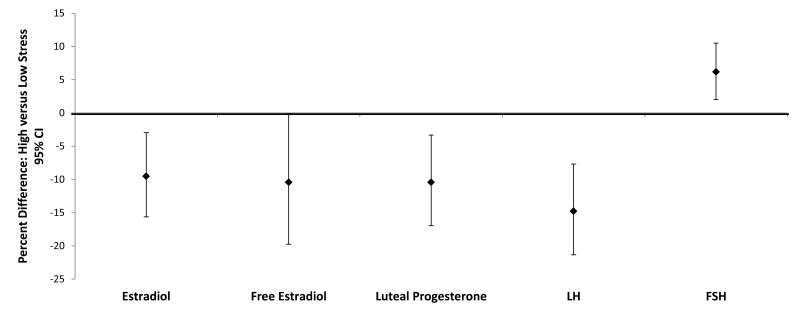
Figure.
Analyses were conducted using weighted linear mixed models and adjusted for age, race, percent body fat, depression score, and time-varying daily vigorous exercise and concurrent reproductive hormones. FSH, follicle-stimulating hormone; LH, luteinizing hormone. Results are presented as average percent change in nontransformed reproductive hormone values for high versus low stress using the following formula: (exp (β) − 1) × 100%

