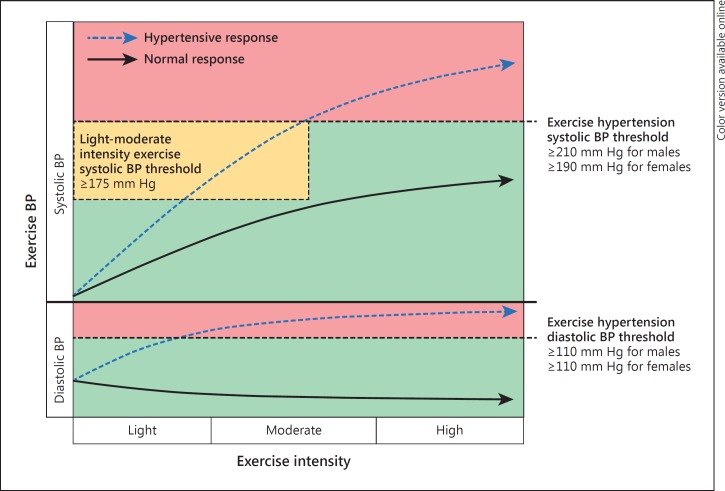
Fig. 1.
Illustration depicting the normotensive and hypertensive response to dynamic physical exercise (HRE). The normotensive response (solid arrows) shows systolic BP gradually increasing in a curvilinear fashion with exercise intensity, whereas diastolic BP remains largely unchanged or slightly decreased. An HRE is depicted by broken arrows and illustrates how both systolic and diastolic BP may increase to a greater extent than a normotensive response, crossing respective BP thresholds (note that this could occur at any exercise intensity) that denote exercise hypertension (systolic BP ≥210 mm Hg for males and ≥190 mm Hg for females, and diastolic BP ≥110 mm Hg for both males and females). Increased propensity to have MH (and increased CV risk) may be identified at a threshold of systolic BP ≥175 mm Hg during light-moderate intensity exercise [based on Schultz et al. [12]].

