Figure 1.
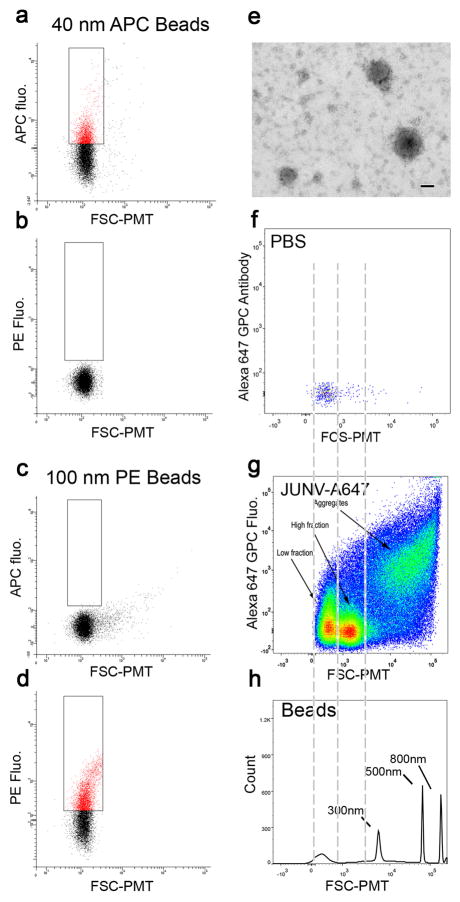
Flow cytometry analysis of small particles. (a–d) 40 nm APC-conjugated latex beads (a,b) and 100 nm PE-conjugated latex beads (c,d) were analyzed on our custom-made flow cytometer and plotted for APC fluorescence (a,c) or PE fluorescence (b,d) as a function of the FSC-PMT parameter. The 40 nm and 100 nm beads were specifically detected from their respective fluorophores. (e) Junin viruses concentrated by ultracentrifugation were adsorbed on carbon-coated TEM grids and labeled with the GPC specific LD05 mouse monoclonal antibody followed by a secondary anti-mouse antibody and revealed by Protein A 10 nm gold beads. Contrast was obtained by negative staining. Bar = 50 nm. JUNV particles of various sizes were all positive for the GPC antibody staining. (f,g) Flow virometry analysis of PBS (f) or purified viral particles stained with a GPC antibody coupled to an Alexa Fluor 647 (JUNV-A647; g). The plot shows Alexa 647 GPC fluorescence versus FSC-PMT. Both samples were run using the same parameters, at the same speed and for the same amount of time. (g) Several populations could be distinguished and are pointed out by labeled arrows. Fluorescence-based thresholding was used to decrease noise events. (h) Non-fluorescent polystyrene beads of larger size (300, 500 and 800 nm) were detected by FSC-PMT channel only. The area between the two first gray dashed lines shows FSC-PMT events that are at the level of the background. The area between the second and third dashed lines correspond to events above background but smaller than 300 nm.

