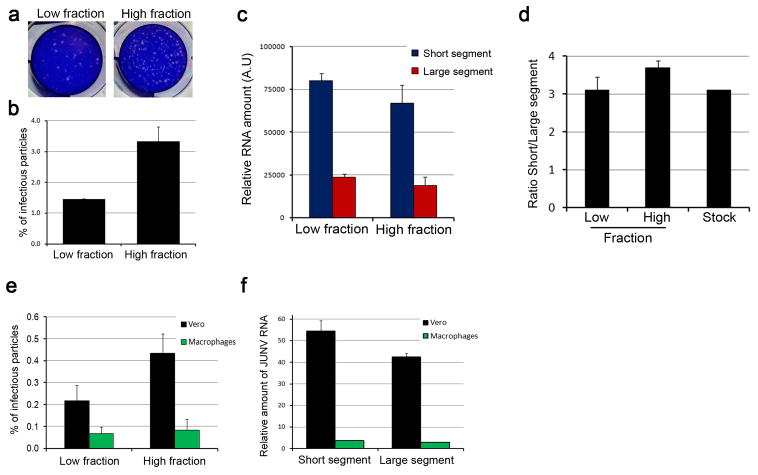
Figure 3.
Infectious properties of sorted particles from the low and high fractions. (a,b) Confluent Vero cells were infected with 3,000 sorted particles in 300 μl virus media for 1h, subsequently overlaid with Virus media containing 1% melted agarose and incubated for 5 days. Plaques forming units were revealed by crystal violet staining. (a) Images correspond to plaques observed in representative wells infected with 3,000 particles from the low (left) and high (right) fractions. (b) Quantification of the percentage of infectious particles from the low and high fractions. Error bars are mean +/− s.d. of duplicates and the histogram is representative of four independent experiments. (c) Relative amount of RNA contained in 20,000 sorted particles for each fraction. Reverse transcriptase RT-qPCR with primers targeting the Short (blue) or the Large (red) segment of JUNV is shown. Low and high fractions showed similar RNA levels for both Short and Large segments. Error bars are the mean +/− s.d. of triplicates and the data is representative of 2 independent experiments. (d) Ratio of the relative amount of Short to Large segment in the low and high fractions and in the virus stock. RNA ratio remains constant in all three samples. (e) Quantification of the percentage of infectious particles produced by Vero cells (black bars) or human primary macrophages (green bars) from the low and high fractions. (f) Relative amount of RNA contained in 15,000 sorted particles from Vero cells (black bars) or human primary macrophages (green bars). Reverse transcriptase RT-qPCR with primers targeting the Short or the Large segment of JUNV is shown. Error bars are the mean +/− s.d. of triplicates.

