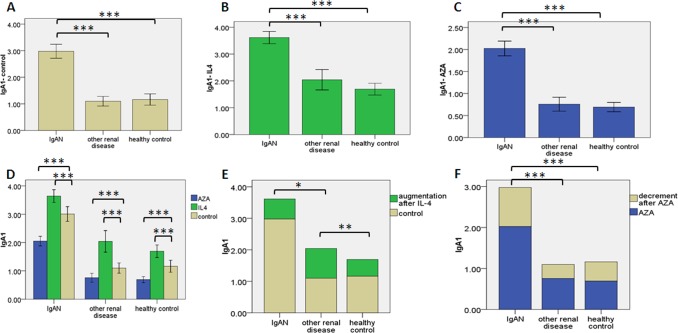
Figure 3. The levels of aberrantly glycosylated IgA1.
The levels of aberrantly glycosylated IgA1 in culture supernatant of B lymphocytes were detected by ELISA. B lymphocytes were from peripheral blood of the 3 groups (IgAN patients, n = 26; other renal disease patients, n = 11; healthy children participants, n = 13). Error bars represent s.e.m. and * denotes a p-value ≤0.05. * *≤ 0.01. * * * for p-value ≤ 0.001. (a) The levels of aberrantly glycosylated IgA1 in 3 groups after 48 hours culturing. (b) The levels of aberrantly glycosylated IgA1 in 3 groups after 48 hours culturing with IL-4(10ng/ml). (c) The levels of aberrantly glycosylated IgA1 in 3 groups after 48 hours culturing with AZA (1 umol/l). (d) The levels of aberrantly glycosylated IgA1 in 3 groups treated or not (beige) with IL-4 (green) or AZA (blue). (e, f) Compared to plain medium, IL-4 or AZA caused the alteration of aberrantly glycosylated IgA1 levels in the other two groups.

