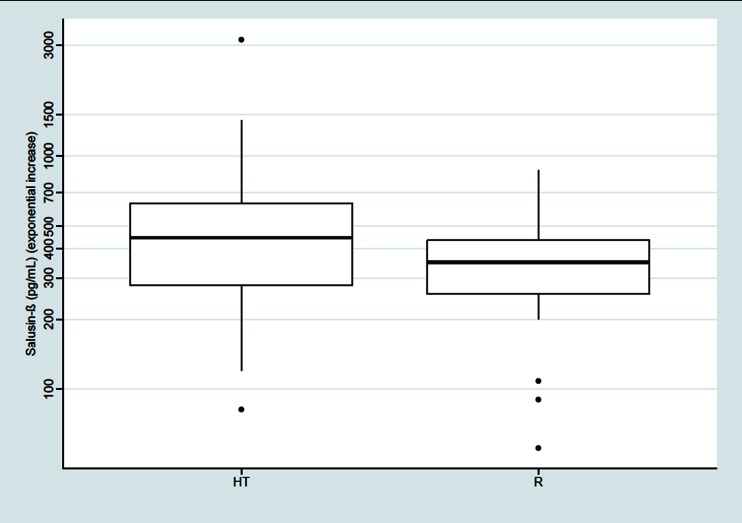
Fig. 1.
Comparison of salusin-β serum level (exponential increase) between the hypertensive subjects (HT) and the reference (R) subjects with white-coat HTN (p < 0.05). Thick black horizontal line Median, top and bottom of box interquartile range (IQR: Q1–Q3), filled circles outliers, whiskers standard deviation (SD)

