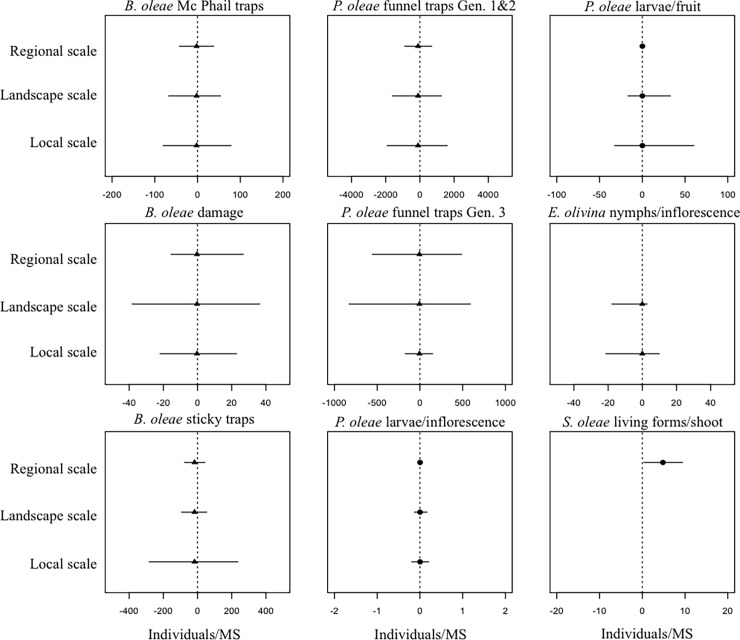
Figure 2. Best model estimations for the differences between ground cover and bare soil for all the response variables.
Positive values represent an increase in pest abundance in the presence of ground cover (filled circle) whereas negative values represent a decrease in pest abundance in the presence of ground cover (filled triangle). Bars represent a 95% of the confidence interval of the random effects predictions (± σ2) at a local, landscape, and regional scale. If a random factor is not included in the selected best model (Table 2), no 95% confidence interval bars were drawn.

