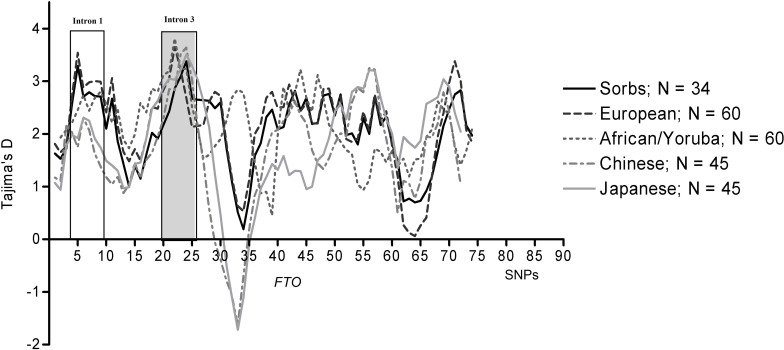
Figure 2. Tajima’s D within the FTO locus from five populations showing signals of selection.
Sliding window analysis of Tajima’s D in the whole gene locus (∼ 1 Mb) was conducted with DnaSP version 4.50.0.3. Populations of European, African, Chinese, Japanese and Sorbs were included in the analysis. Closely related individuals were removed, i.e. trios from Chinese and Japanese populations and individuals with IBD > 0.05 from Sorbs. Higher values of Tajima’s D were observed at the intron 3.

