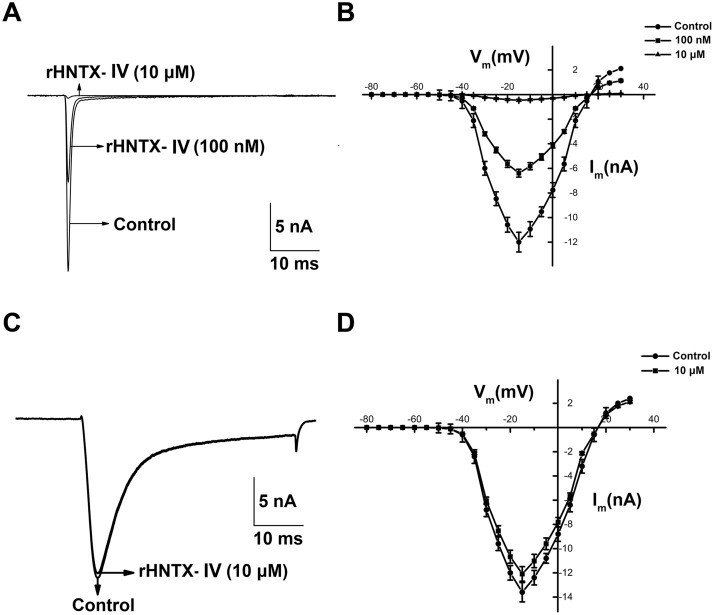
Fig 6. Functional characterization of the venom on voltage-gated sodium channels.
A) Typical current traces from TTX-S Na+ channel before and after application of 100 nM and 10 μM rHNTX- IV. B) The I-V curve of TTX-S I Na with 100 nM and 10 μM rHNTX- IV. C) Typical current traces from TTX-R Na+ channel before and after application of 10 μM rHNTX- IV. D) The I-V curve of TTX-R I Na with 100 nM rHNTX- IV. The data points (means ± S.E.) come from at least five cells.

