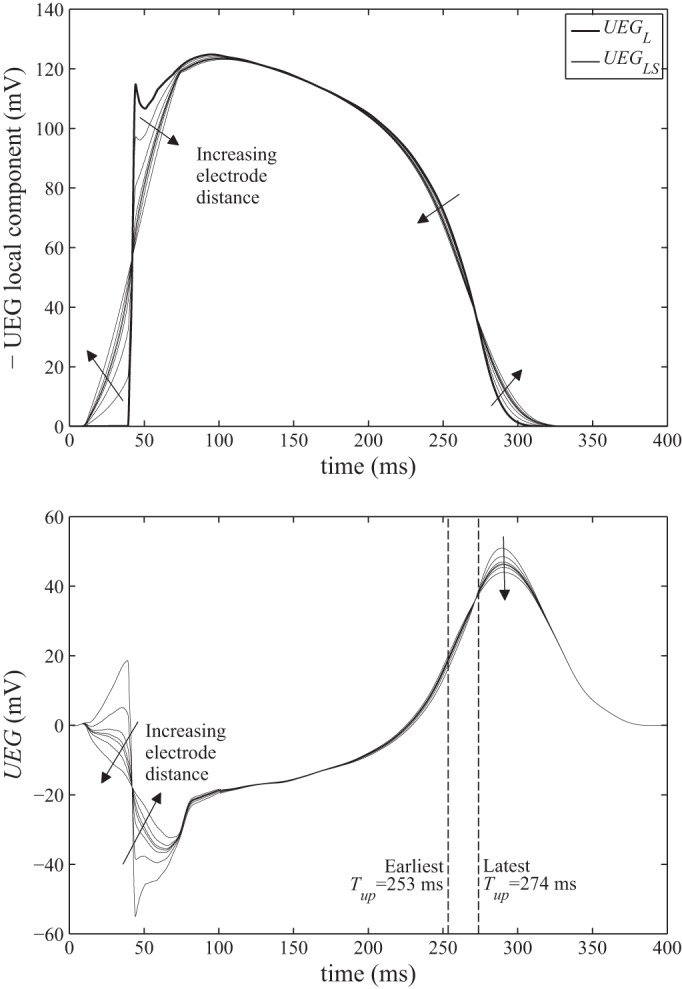
Fig. 4.

Top: local surface components (UEGLS) calculated using Eq. 5 with the distance to the tissue surface, z, varying from 0.004 to 16 mm. For comparison, the local component used by Ref. 19 (UEGL, whose morphology is identical to that of the local membrane potential) is shown in bold. Note that the traces have been inverted to emphasize their resemblance to the familiar action potential morphology. Filled arrows indicate the sense in which the signal morphology alters as the electrode distance increases. Bottom: electrograms calculated from the local surface components at the top. Dashed vertical lines indicate the earliest and latest timings of Tup, which correspond to the largest (16 mm) and smallest (0.004 mm) electrode distances, respectively.
