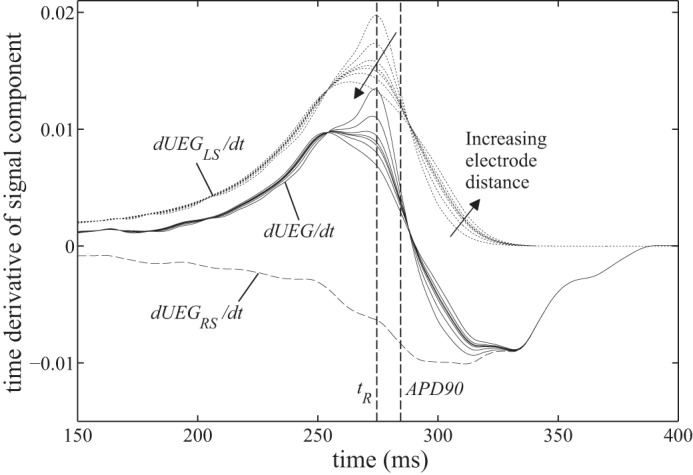
Fig. 5.

Variation in the electrogram's time derivative during repolarization (i.e., T-wave slope), as the distance from the exploring electrode to the tissue surface varies from 0.004 to 16 mm, for the high dispersion case. The electrogram's time derivative, dUEG/dt, can be calculated as the sum of the 2 components' derivatives, dUEGLS/dt (dotted lines) and dUEGRS/dt (dashed line), which are shown to clarify their separate contributions to dUEG/dt.
