
Fig 5. Effects of FA and OZ on hepatic function.
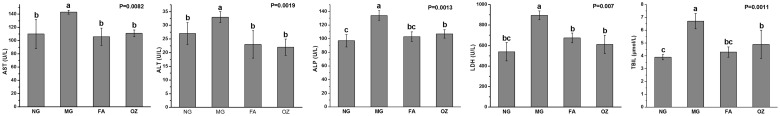
(A): Aspartate aminotransferase activity; (B): Alanine aminotransferase activity; (C): Alkaline phosphatase activity; (D): Lactate dehydrogenase activity; (E) Total bilirubin level. Data are presented as mean ± SD (n = 6 per group). Mean values with different letters are significantly different (P<0.05). P values were determined by Kruskal-Wallis test. NG, normal group; MG, high-fat and high-fructose diet (HFFD); FA, HFFD plus ferulic acid; OZ, HFFD plus γ-oryzanol.