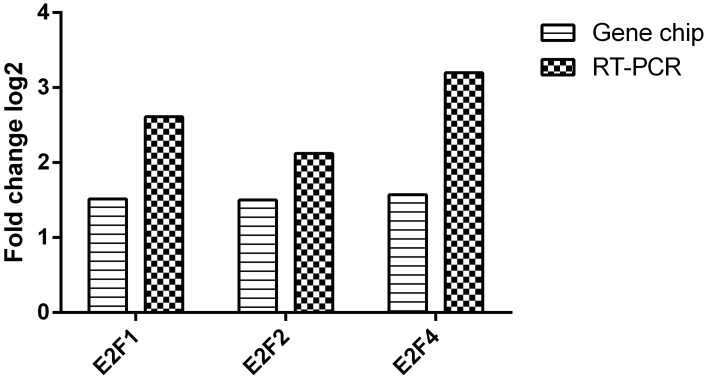
Fig 6. Validation of differential expression of mRNAs using qRT-PCR.
Gene expression was analyzed in 10 paired gastric cancerous and normal tissues and compared to microarray results. The columns in the chart represent the log-transformed median fold changes (cancer/control) in expression across ten samples (p<0.05).

