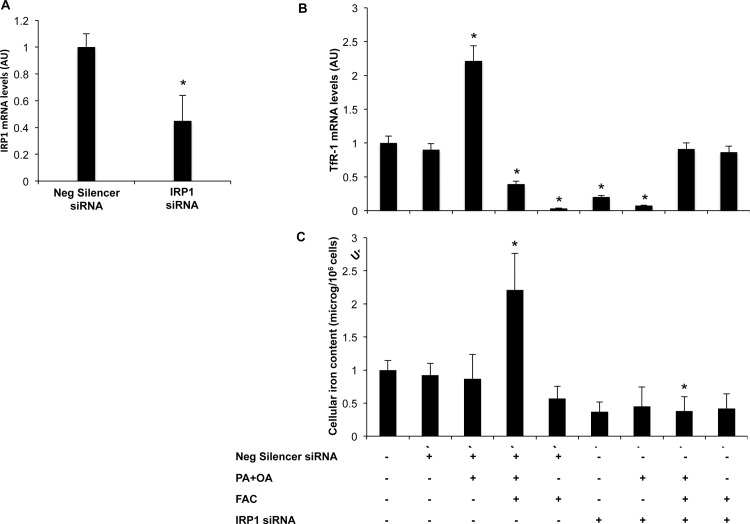
Figure 7. IRP1 gene silencing in HepG2 hepatocytes.
A) IRP1 siRNA treatment of HepG2 cells reduced IRP1 mRNA levels compared to control cells (about 60%). B) TfR-1 mRNA levels evaluated by qRT-PCR in HepG2 treated with IRP1 siRNA or Negative silencer siRNA. C) Intracellular iron concentration was measured by atomic absorption spectrometry in HepG2 cells treated with IRP1 siRNA or Negative silencer siRNA. Results are mean values of three independent experiments, each experimental condition was evaluated in triplicate. Values are expressed as means±SD. AU, arbitrary units. *p<0.05 vs. untreated cells plus transfection reagent (lipofectamine).

