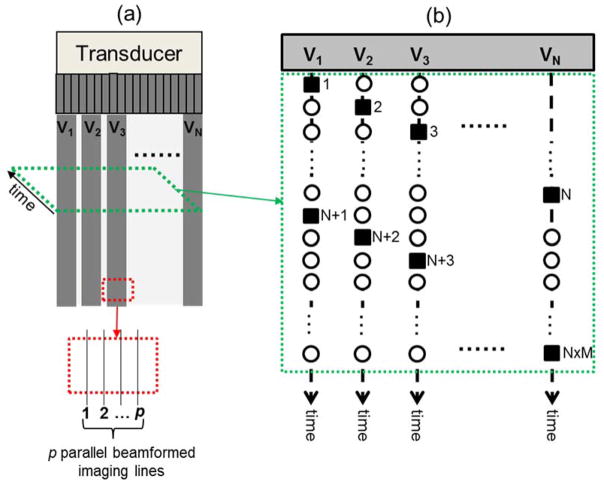
Figure 1.
Schematic plots of the sequential shear wave tracking sequence. (a) imaging FOV and the imaging vectors. Each imaging vector contains p imaging lines that can be parallel beamformed. The tracking sequence within a slice of the data at a certain depth is shown in (b), as indicated by the green dashed parallelogram with an arrow indicating the temporal direction (slow time). (b) the sequential tracking sequence of the N imaging vectors. The solid squares indicate the tracked shear wave data points. The hollow circles indicate the missed data points.

