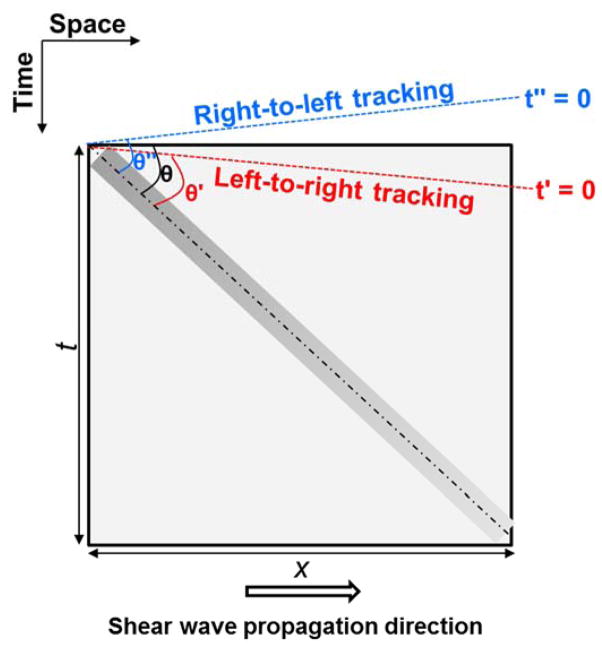
Figure 4.
Schematic plot of the relationship between detected shear wave signal (the bar-shaped rectangle with gradient) and TAST tracking sequence. The shear wave propagates from left to right. If the tracking direction is left-to-right, then the apparent shear wave speed will be biased high (indicated by θ′ which is smaller than θ); if the tracking direction is right-to-left, then the apparent shear wave speed will be biased low (indicated by θ″ which is greater than θ). Shear wave speed is given by cot(θ). The t′ and t″ lines indicate the apparent starting times of the shear wave signal detected by the sequential tracking scheme.

