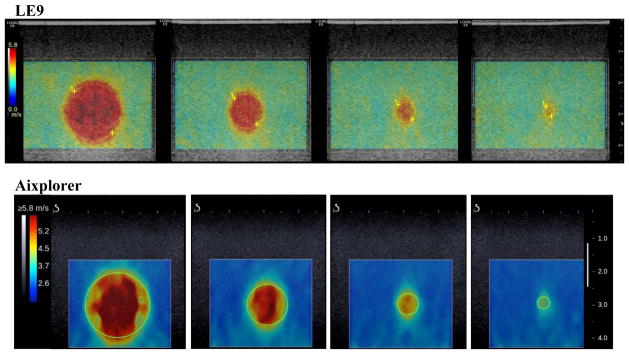
Figure 7.

Top row: 2D shear wave speed maps of the Type IV inclusions from the 9L-D probe of LE9. All maps are under the same color scale. The yellow dashed circles indicate the ROIs selected for shear wave speed measurements. Bottom row: 2D shear wave speed maps of the Type IV inclusions from the L10-2 probe of the Aixplorer. All maps are under the same color scale. The green solid circles indicate the ROIs selected for shear wave speed measurements.
