Figure 8.

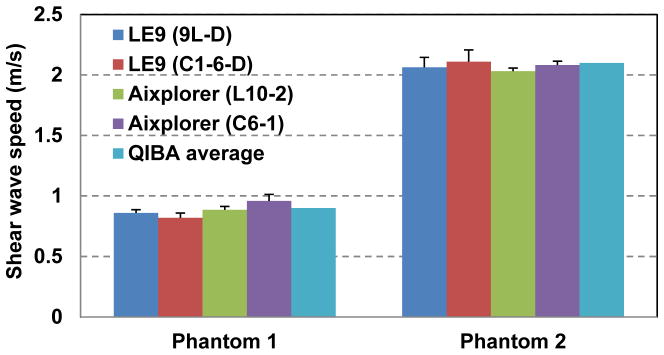
Bar plots of the mean shear wave speed measurements of the two CIRS phantoms from the LE9 and the Aixplorer. The error bars indicate the standard deviation values from multiple independent data acquisitions at different depths.

Bar plots of the mean shear wave speed measurements of the two CIRS phantoms from the LE9 and the Aixplorer. The error bars indicate the standard deviation values from multiple independent data acquisitions at different depths.