
Fig. 13.
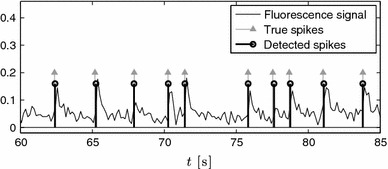
Fluorescence signal and detected spikes using the double consistency approach. The spikes are detected from the peaks of the histogram in Fig. 12c
Official websites use .gov
A
.gov website belongs to an official
government organization in the United States.
Secure .gov websites use HTTPS
A lock (
) or https:// means you've safely
connected to the .gov website. Share sensitive
information only on official, secure websites.
Fluorescence signal and detected spikes using the double consistency approach. The spikes are detected from the peaks of the histogram in Fig. 12c